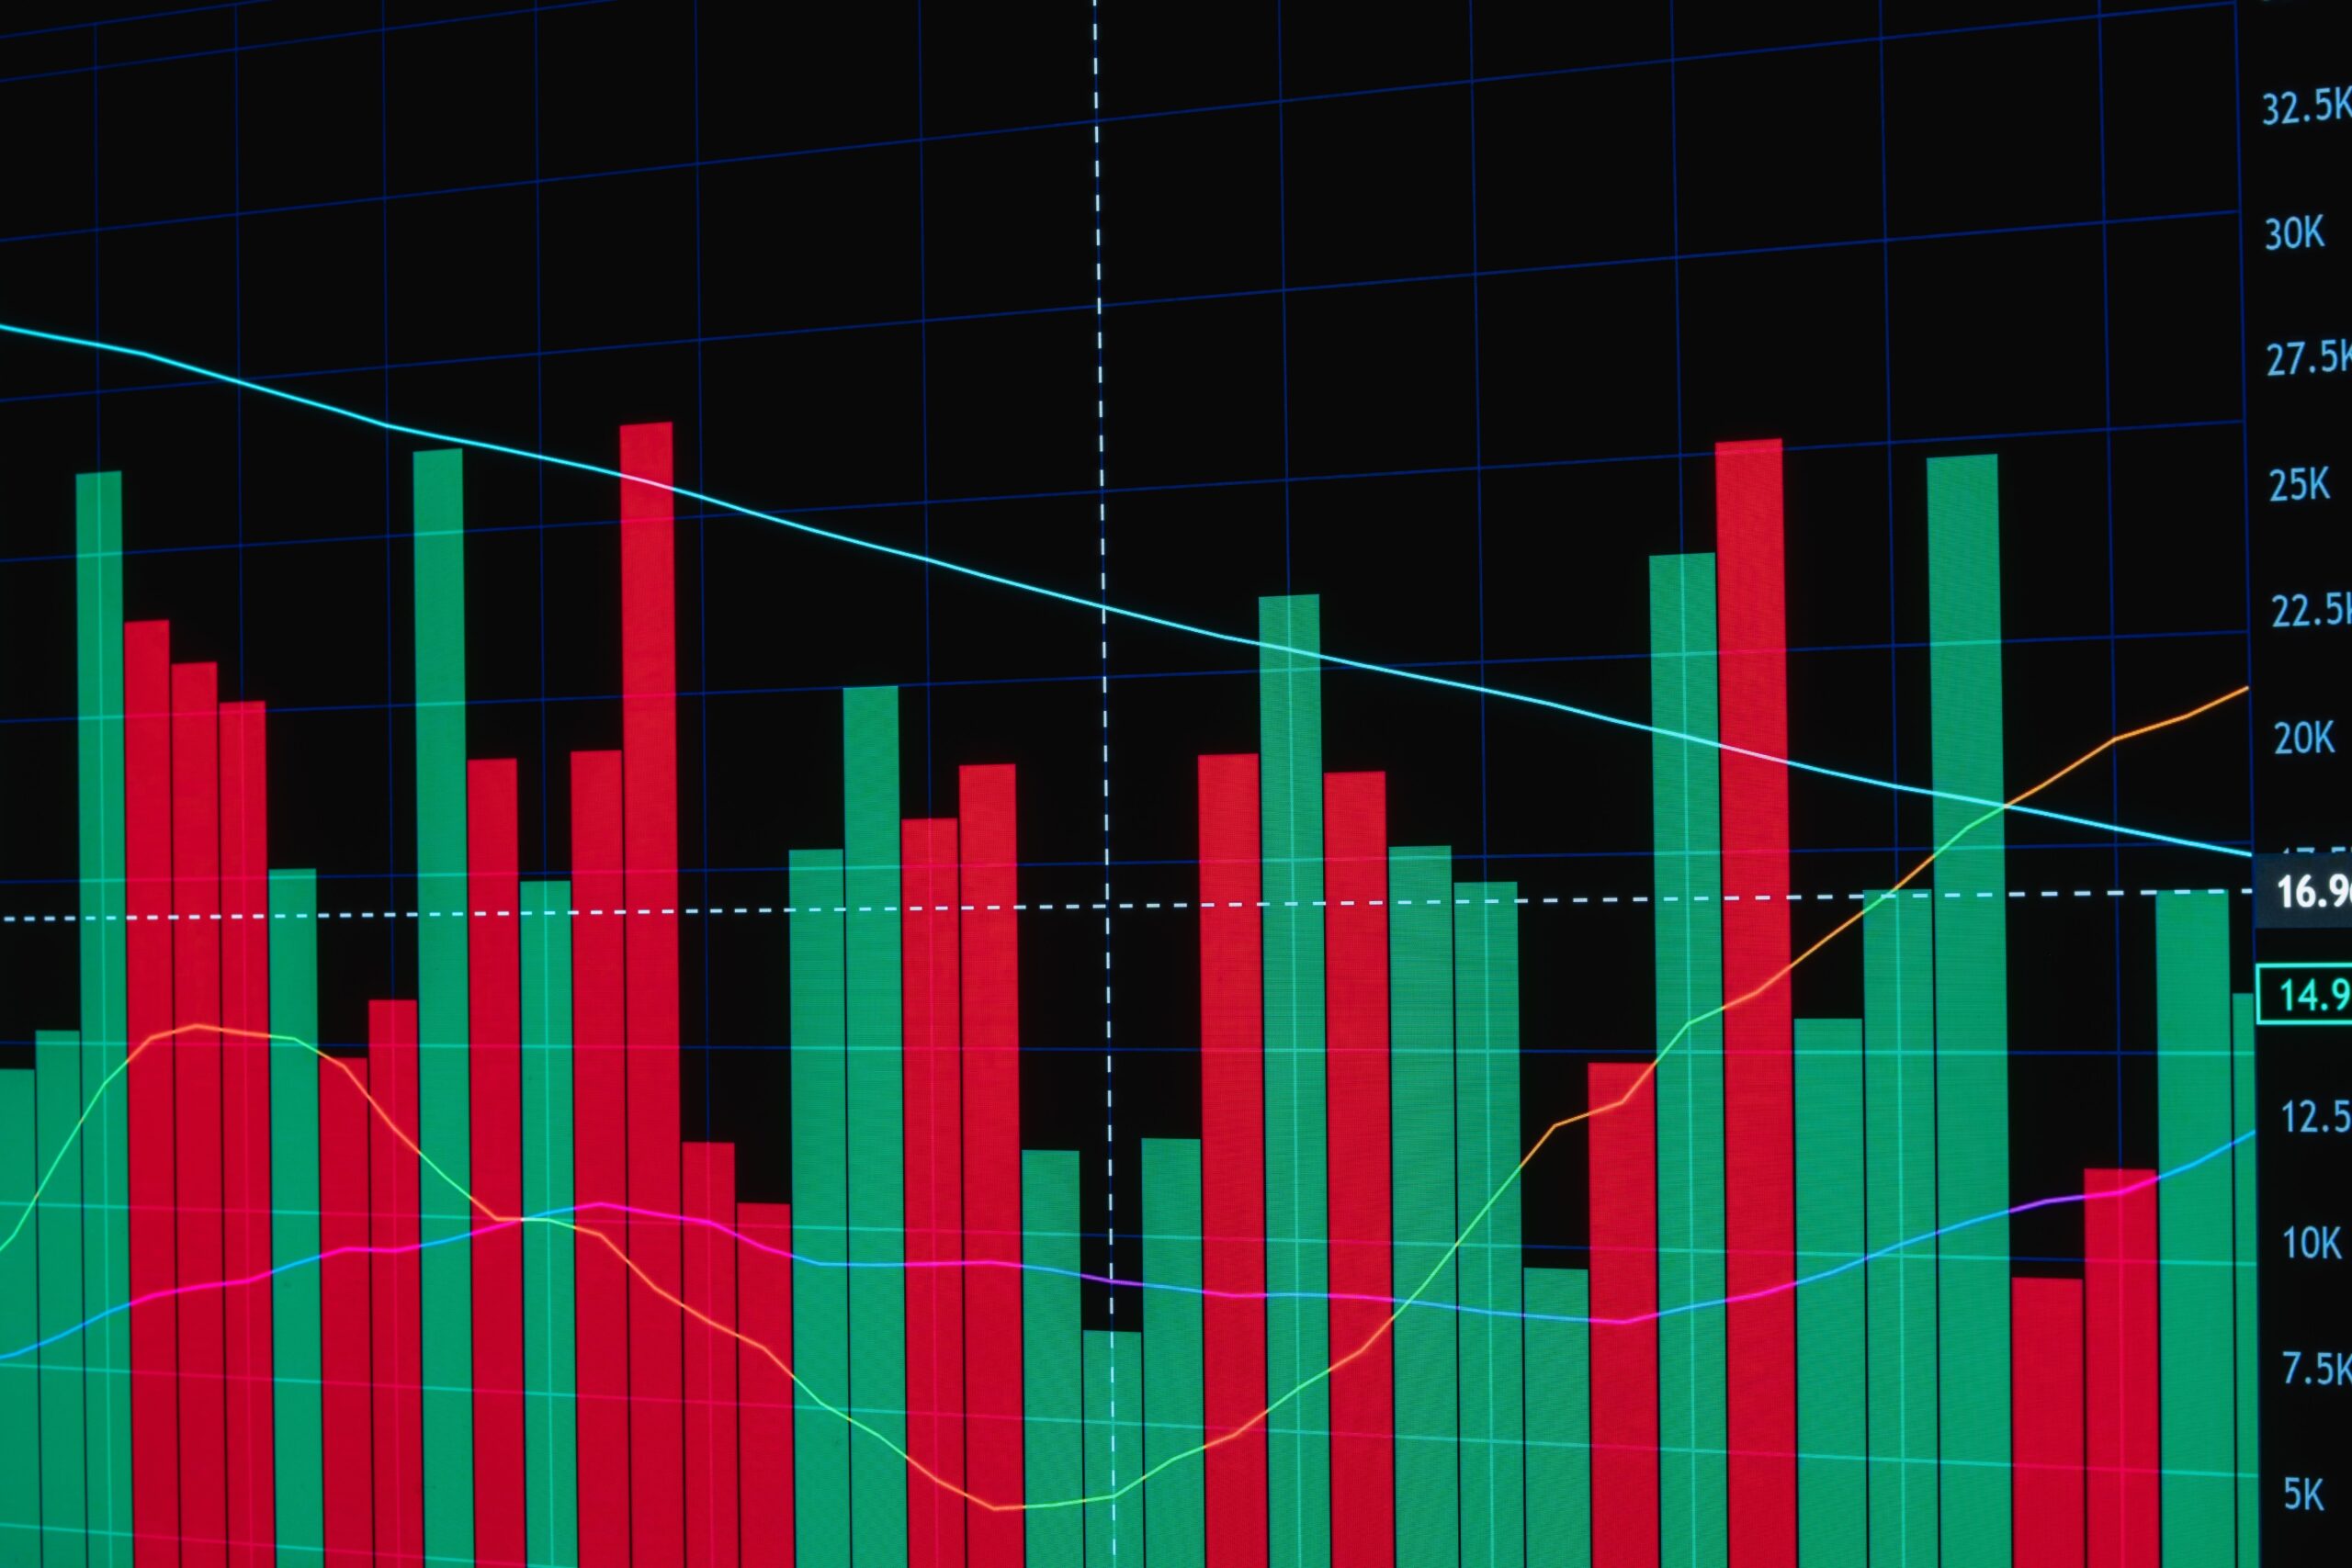
Learning how to read forex charts usually starts with staring at a wall of green and red candles that mean nothing yet. The good news: the core logic behind a candlestick chart is simple once explained properly, and almost everything built on top of it — indicators, patterns, timeframes — is just a variation on that one basic building block.
How to read forex charts: the candlestick, explained
Bullish (price rose)
Bearish (price fell)
Each candlestick represents one time period (a minute, an hour, a day — whatever the chart’s timeframe is set to) and shows four prices at once: the open, the close, and the highest and lowest points reached during that period. The thick “body” spans open to close; the thin “wicks” above and below show the extremes reached but not held. A green (or sometimes blue) body means the price closed higher than it opened; red means it closed lower.
Choosing a timeframe when reading forex charts
Shorter timeframes (minutes)
Show more noise and short-term volatility, used by very active, short-horizon traders.
Longer timeframes (daily/weekly)
Smooth out short-term noise, showing broader trend direction over more time.
There’s no universally “correct” timeframe — it should match how often you actually intend to act on what you see, since a chart showing minute-by-minute moves is of limited use to someone making decisions weekly.
A short glossary for reading forex charts
Common terms you’ll run into immediately
Treating chart patterns as guarantees rather than probabilities. Historical price shapes can offer context, but they don’t reliably predict future moves with certainty — chart reading is a tool for structuring a view, not a crystal ball.
What are pips in forex trading?
A pip (percentage in point) is the standard unit used to measure a price move in most forex pairs, typically the fourth decimal place (or second, for pairs involving the Japanese yen). Once you can read a candlestick, pips are the next building block: they’re how traders quantify exactly how far a price actually moved, rather than describing a chart move only in vague terms like “up a bit” or “down sharply.” Most charting platforms display price changes in pips directly, so you don’t need to calculate them manually, but understanding what the number represents makes the rest of the chart far more readable.
How to read forex candlestick patterns beyond a single candle
A single candlestick tells you what happened in one period; patterns made of two or three candles together are where a lot of beginner chart-reading guides jump to next. A few of the most commonly referenced: an “engulfing” pattern, where one candle’s body fully covers the previous candle’s body, often read as a potential short-term reversal signal; and a “doji,” a candle with a very small body and longer wicks, suggesting indecision between buyers and sellers during that period. These patterns are observational labels for common price shapes, not formulas that guarantee a specific outcome.
How to use moving averages when reading forex charts
A moving average smooths out short-term noise by plotting the average price over a set number of recent periods, updating as each new period completes. Traders commonly watch for the price crossing above or below a moving average, or for a shorter-period average crossing a longer-period one, as a simple way to gauge whether a trend is strengthening or losing momentum — again, a tool for context, not a standalone signal to act on in isolation.
Frequently Asked Questions
What does a candlestick actually show on a forex chart?
The opening and closing price for a time period, plus the highest and lowest prices reached, with colour indicating whether the price rose or fell over that period.
What timeframe should a beginner use to read forex charts?
A daily or 4-hour chart generally shows clearer, less noisy trends for beginners than very short timeframes like 1-minute charts.
What is support and resistance on a forex chart?
Support is a price level a chart has historically struggled to fall below; resistance is a level it has historically struggled to rise above.
Do chart patterns guarantee future price movement?
No, they indicate historical tendencies and probabilities, not certainties, and should be treated as one input rather than a reliable prediction.
What are pips in forex trading?
The standard unit used to measure a price move in most forex pairs, typically the fourth decimal place, letting traders quantify exactly how far a price has moved.
What is a doji candlestick pattern?
A candle with a very small body and longer wicks, suggesting indecision between buyers and sellers during that period rather than a clear directional move.
How do moving averages help when reading forex charts?
They smooth out short-term price noise into a single trend line, making it easier to judge whether a trend is strengthening or losing momentum over time.
Want a platform’s charting and execution tested?
We independently test trading platforms on real accounts before publishing a verdict — not sponsored placements.